Note
Click here to download the full example code
Simple map
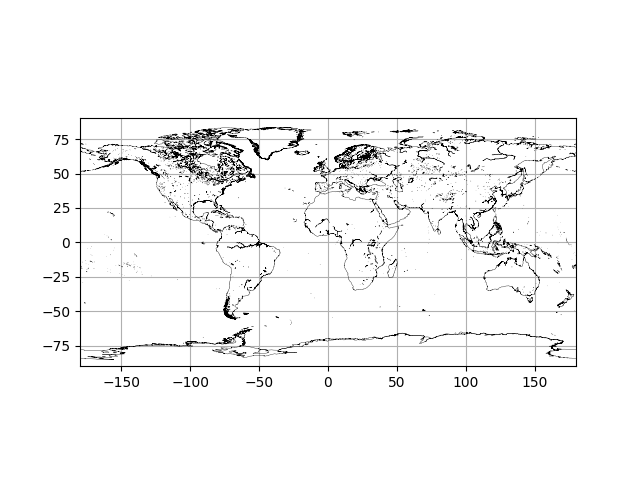
from matplotlib import pyplot as plt
import pylook

fig = plt.figure()
ax = fig.add_subplot(111, projection='plat_carre')
ax.grid(True)
Total running time of the script: ( 0 minutes 0.433 seconds)